Boek
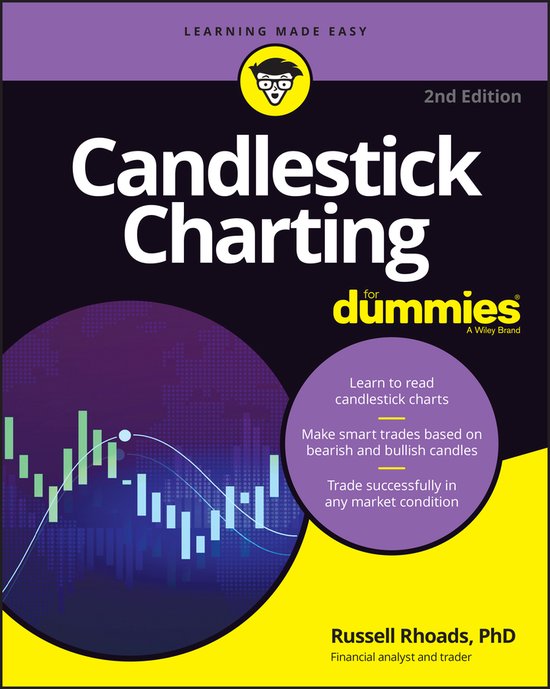
Candlestick Charting For Dummies
Huidige prijs op bol.com (Nederland)
€ 19,00
Bekijk op bol.com
Boek
Huidige prijs op bol.com (Nederland)
Ontvang een e-mail bij een prijsdaling tot onder je gewenste prijs.
Je ontvangt een e-mail wanneer de prijs daalt.
We volgen de prijsontwikkeling van dit product op bol.com (Nederland).
Make smarter stock trades by reading the charts
Candlesticks come in handy when the power goes out, and candlestick charts can help shine a light on the movement of stock prices, so you’re not making investment decisions in the dark. Candlestick Charting For Dummies demystifies these weird little graphs, showing you how to read the charts, recognize the patterns, and start trading like a pro. Fully updated for the latest stock market trends and changes (including Bitcoin!), this book puts technical tools at your fingertips. Now, go run with the bulls (or the bears).
Inside…
Demystify stock charts so you can up your investing game
Candlestick Charting For Dummies is here to show you that candlestick charts are not just for Wall Street traders. Everyday investors like you can make sense of all those little lines and boxes, with just a little friendly Dummies training. We’ll show you where to find these charts (online or in your favorite investing app), what they mean, and how to dig out valuable information. Then, you’ll be ready to buy and sell with newfound stock market savvy.
Candlestick Charting For Dummies helps you build a foundation of investing knowledge and lingo (bullish? bearish? What is a candlestick, anyway?), then shows you the chart-reading ropes with relevant and easy-to-understand examples. It covers the latest investing technology, cryptocurrency, and today’s somewhat-less-predictable market environment.
This is the Dummies guide for beginner and intermediate investors who want to make smarter decisions with a better understanding of how to read candlestick charts.
Bekijk ook eens deze gerelateerde producten.